You run the analysis
This site is the workshop. Each step pairs the prose you are reading with a notebook you run, and the numbers in the prose come from those notebooks.

AFROTECH 2026
A hands-on investigation of where harm enters a clinical AI pipeline.
Standard blood tests may not change, but the equations we use to interpret them can as medical knowledge evolves. These changes can alter the clinical decisions that follow.
As clinical AI becomes more deeply integrated into care, those same measurements and estimates can also become model inputs. Auditing what enters the model matters just as much as evaluating what comes out.
AI models can look safe on headline metrics while hidden harm lingers.

In situ 3D reconstruction and tomographic sectioning of the kidneys from CT contrast-enhanced images. New image reconstruction techniques allow visualization of the kidneys in multiple angles and planes and thereby detection of subtle changes in kidney structure. Source: Lilach O. Lerman Laboratory, Mayo Clinic Research. (Videos)
Kidney disease does not fall evenly across the United States. The disproportionate burden carried by Black Americans is why a national task force was convened at all, to reassess whether race belonged in the diagnosis of kidney disease (NKF-ASN Task Force).
When kidney function estimates help determine diagnosis, disease stage, treatment, and eligibility for care, the way those estimates are calculated has consequences beyond the equation itself.
A number becomes a stage. A stage becomes an eligibility rule. An eligibility rule reaches a person.
To understand this case, we need to understand eGFR: an estimate of how well the kidneys are filtering blood.
GFR, or glomerular filtration rate, describes kidney filtration function. Measuring it directly is possible, but it is more cumbersome than the routine blood testing used in everyday clinical care. So in practice, kidney function is usually estimated instead.
That estimate is called eGFR: estimated glomerular filtration rate.
A blood test measures creatinine, a waste product that the kidneys normally clear from the blood. An equation then combines creatinine with information such as age and sex to estimate kidney function.
In general, higher creatinine corresponds to lower estimated kidney function.
That estimate can influence disease staging, medication dosing, specialist referral, and evaluation for kidney transplantation.
The distinction that matters for this workshop is simple:
GFR is the kidney function we want to know. eGFR is our estimate of it.
And that estimate does not appear on its own. It is produced by an equation, and the design of that equation is a modeling choice.
The blood measurement stays the same. The transformation changes.
eGFR = 141 * min(Scr/k, 1)a * max(Scr/k,
1)-1.209 * 0.993Age * 1.018if female *
1.159if Black
Scr = serum creatinine; k = 0.7 for female, 0.9 for male; a = -0.329 for female, -0.411 for male.
eGFR = 142 * min(Scr/k, 1)a * max(Scr/k,
1)-1.200 * 0.9938Age * 1.012if female
Scr = serum creatinine; k = 0.7 for female, 0.9 for male; a = -0.241 for female, -0.302 for male.
Now let’s follow that estimate through two patients.
They are the same age. The same sex. Their blood was drawn the same morning, and both have the same creatinine level.
Under the equation used for decades, the patient recorded as Black would receive a higher eGFR than the patient recorded as non-Black.
A higher eGFR suggests better kidney function.
So the same underlying blood test could produce two different estimates of kidney function based on race.
In 2021, that race coefficient was removed from the recommended equation.
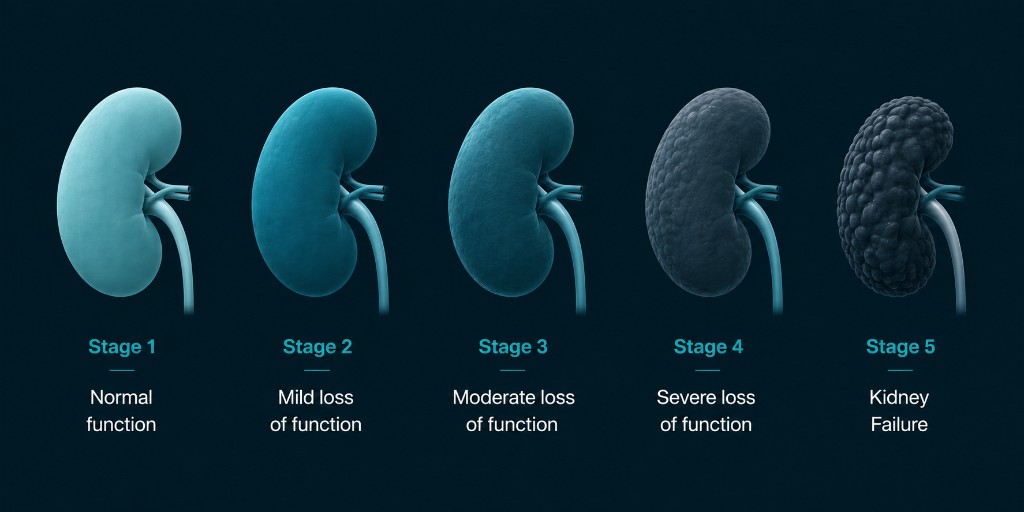
Kidney disease progression, shown as stages 1 through 5 from normal function to kidney failure.
The kidneys do several jobs at once. They remove waste and excess fluid, regulate electrolytes and acid-base balance, help control blood pressure, support red blood cell production, and activate vitamin D.
Glomerular filtration rate, or GFR, focuses on one of those jobs: filtration. It describes how much plasma the kidneys filter over time and has become one of the main measures used to describe kidney function.
That number matters because clinical decisions are often organized around it. GFR can help inform CKD staging, medication use, specialist referral, and kidney transplant evaluation.
The problem is that measuring GFR is not simple.
A measured GFR typically requires giving a filtration marker and tracking how efficiently the kidneys clear it. The process is more complex and time-consuming than routine blood testing, so it is generally reserved for situations where a more precise measurement is needed.
For everyday care, the much more practical starting point is serum creatinine.
Creatinine is a waste product generated largely from normal muscle metabolism. Healthy kidneys remove it from the blood. When filtration declines, creatinine tends to accumulate.
Creatinine and estimated kidney function generally move in opposite directions. As creatinine rises, eGFR usually falls.
That relationship is worth fixing in mind now, because it explains why a higher eGFR makes kidney function appear better, not worse.
But creatinine alone cannot tell us GFR.
Its concentration is affected not only by kidney filtration but also by factors such as muscle mass, diet, age, and sex. Two people can therefore have the same creatinine level without having exactly the same kidney function.
That is where the estimating equation enters.
The 2009 CKD-EPI equation combined serum creatinine with age, sex, and a race term to estimate GFR. Those additional variables served as proxies for differences that creatinine alone could not capture.
The race term divided patients into two groups: Black and non-Black. For otherwise identical inputs, the equation produced a higher eGFR for the patient recorded as Black.
And that is the modeling decision we are going to follow.
The pattern should feel familiar to anyone who builds models: a variable we actually care about is difficult to measure, so we substitute variables that are easier to obtain and correlated with it.
Sometimes that improves aggregate model performance.
But a proxy is still a choice.
And when that choice sits inside a clinical equation used at scale, its consequences can travel much farther than the model itself.
Five questions already have answers in the literature. None of them is the question this workshop asks.
| Question | What the evidence says |
|---|---|
| Why was race in the equation? | As a statistical proxy. Levey et al. 2009 included age, sex and race as surrogates for factors that affect serum creatinine independently of GFR. In the development data, the race term improved prediction and produced a coefficient of 1.159 for patients classified as Black. The same paper acknowledged that these variables could not capture all of the non-GFR variation in creatinine. |
| Did removing race solve the estimation problem? | No. Inker et al. 2021 compared race-based and race-free equations against measured GFR. With the 2009 creatinine equation, the difference in systematic error between Black and non-Black participants was 3.2 mL/min/1.73m². In the new creatinine-only equation without race, that difference was 7.6. Removing the variable removed race from the calculation, but it did not remove the underlying differences the model had been using race to absorb. |
| Can changing the development mix eliminate that gap? | Not in this creatinine-only setup. Inker’s sensitivity analysis varied the proportion of Black participants in the development data from 0% to 100%. That changed how much bias each group experienced, but it did not eliminate the difference in bias between groups. Changing who dominates the training data changes where the error lands; it does not necessarily remove the underlying error. |
| What improved the estimate? | More informative measurement. Adding cystatin C, a second filtration marker with different non-GFR determinants, substantially reduced the between-group difference. The 2021 creatinine–cystatin C equation without race reduced differential bias from 7.6 to 3.0 mL/min/1.73m² and was more accurate overall than the creatinine-only race-free equation. |
| How was the national decision made? | Not on predictive accuracy alone. The NKF-ASN Task Force identified 26 possible approaches, narrowed them to five, and evaluated them across six attributes: assay availability and standardization, implementation, diversity of the development population, performance against measured GFR, consequences for care and research, and patient centeredness. The Task Force ultimately recommended the race-free 2021 creatinine equation because it removed race, could be implemented immediately, had acceptable performance, and was judged unlikely to impose disproportionate consequences on any one group. |
That leaves us with a different question:
When a model performs well overall, how do we test whether the error is being distributed acceptably before that model reaches a decision?
Two studies followed the consequences of race-based kidney function estimation into two different clinical decisions, and found very different downstream effects.
Cusick et al. 2024 studied 547,194 adults as one health system switched to the 2021 race-free eGFR equation. For patients documented as Black, estimated kidney function fell and more measurements crossed into more severe CKD stages.
But nephrology referrals did not meaningfully change.
The number moved. The downstream decision largely did not.
Khazanchi et al. 2026 studied a national transplant policy created to restore waiting time to Black kidney transplant candidates whose eligibility may have been delayed by the prior race-based eGFR calculation. Between January 2023 and June 2025, 21,119 candidates received adjustments totaling 51,061 person-years of restored wait time. Policy implementation was associated with an increase in transplant rates among Black candidates.
In that setting, changing the consequence attached to the number changed who moved through the system.
That contrast is worth further review.
Changing a model output does not tell us whether a clinical decision will change. That depends on what happens downstream: where thresholds sit, how eligibility is defined, and what action is attached to crossing them.
Cusick et al. also identify an outcome their study could not evaluate: medication eligibility.
That is where this workshop picks up.
The question is not whether an equation looks better, whether an aggregate metric improved, or whether a model card reads more cleanly.
The question is:
Who moves?
By the end of the hour, you should be able to:
You run the analysis
This site is the workshop. Each step pairs the prose you are reading with a notebook you run, and the numbers in the prose come from those notebooks.
No local setup
A browser and a Google account are enough for the default path. Colab is the primary runtime, and the notebooks are designed to run without local configuration.
Real data, reproducible results
CDC NHANES, 14,788 adults, with linked mortality outcomes. Race is self-reported in NHANES, and the numbers on this site come from the same analysis pipeline used in the notebooks.
You test the claims yourself
Short coding challenges are built throughout the notebooks. You will test assumptions, reproduce findings, compare subgroups, and make decisions about what to examine next. The Hidden Harm Challenge expands that into a more open-ended subgroup search.
Live workshop route: start at 2. The impact of one lab value.
Durations below reflect the in-session live route and sum to 55:00. A self-paced reader should expect roughly double.
Where this goes wrong is not where you expect.
Trace one clinical number from the equation to a CKD classification. Nothing here involves a model.
You will find: changing the equation changes who crosses a clinical line.
Put the two equations through a real mortality model and a real prescribing decision, and watch the aggregate metric hold still.
You will find: a model can look unchanged while a clinical decision changes.
Find the Hidden Harm. You choose where the search looks. This is the close of the analysis.
You will find: what you find depends on where you look, what you measure, and what the trade offs are for adding complexity to your search.
Take the method with you.
You will leave with: a go/no-go list, and one thing to do Monday.
The goal is not to convince you that one particular model is fair or unfair. It is to hand you a repeatable method for auditing a clinical AI pipeline before it reaches a patient, and a gate you commit to before you know the answer.
Start the live workshop →Waverly Rose Brim is an AI Research Engineer currently at the Johns Hopkins Bloomberg School of Public Health, who works at the intersection of foundation models, biomedical data, and surgical data science. Her work spans multimodal foundation models, biomedical representation learning, computational pathology, and computer vision for clinical decision systems, including a production LLM retrieval service for clinical decision support and real-time surgical skill assessment. Earlier work covers multimodal pathology and genomics in meningioma, and genetically encoded voltage indicators built on a DARPA-funded neural engineering program. She has 20+ peer-reviewed publications, concentrated in AI for neuro-oncology.
She wrote the analysis, the notebooks, the package and this site.